Introduction
Designer is the desktop application where you create and configure projects: tags, alarms, screens, scripts, communication, historian, security, machine learning, and schedules.
Runtime is the execution environment that loads the built project and runs data acquisition, visualization, alarm handling, and related services according to your configuration.

End-to-end workflow
- Create or open a project in AccuTrack Designer.
- Configure modules in an order that respects dependencies (tags and communication before screens and alarms, for example).
- Build the project to validate configuration and produce a deployment package.
- Transfer the package to the target device running AccuTrack Runtime.
- Run the project on the device.
AccuTrack Designer
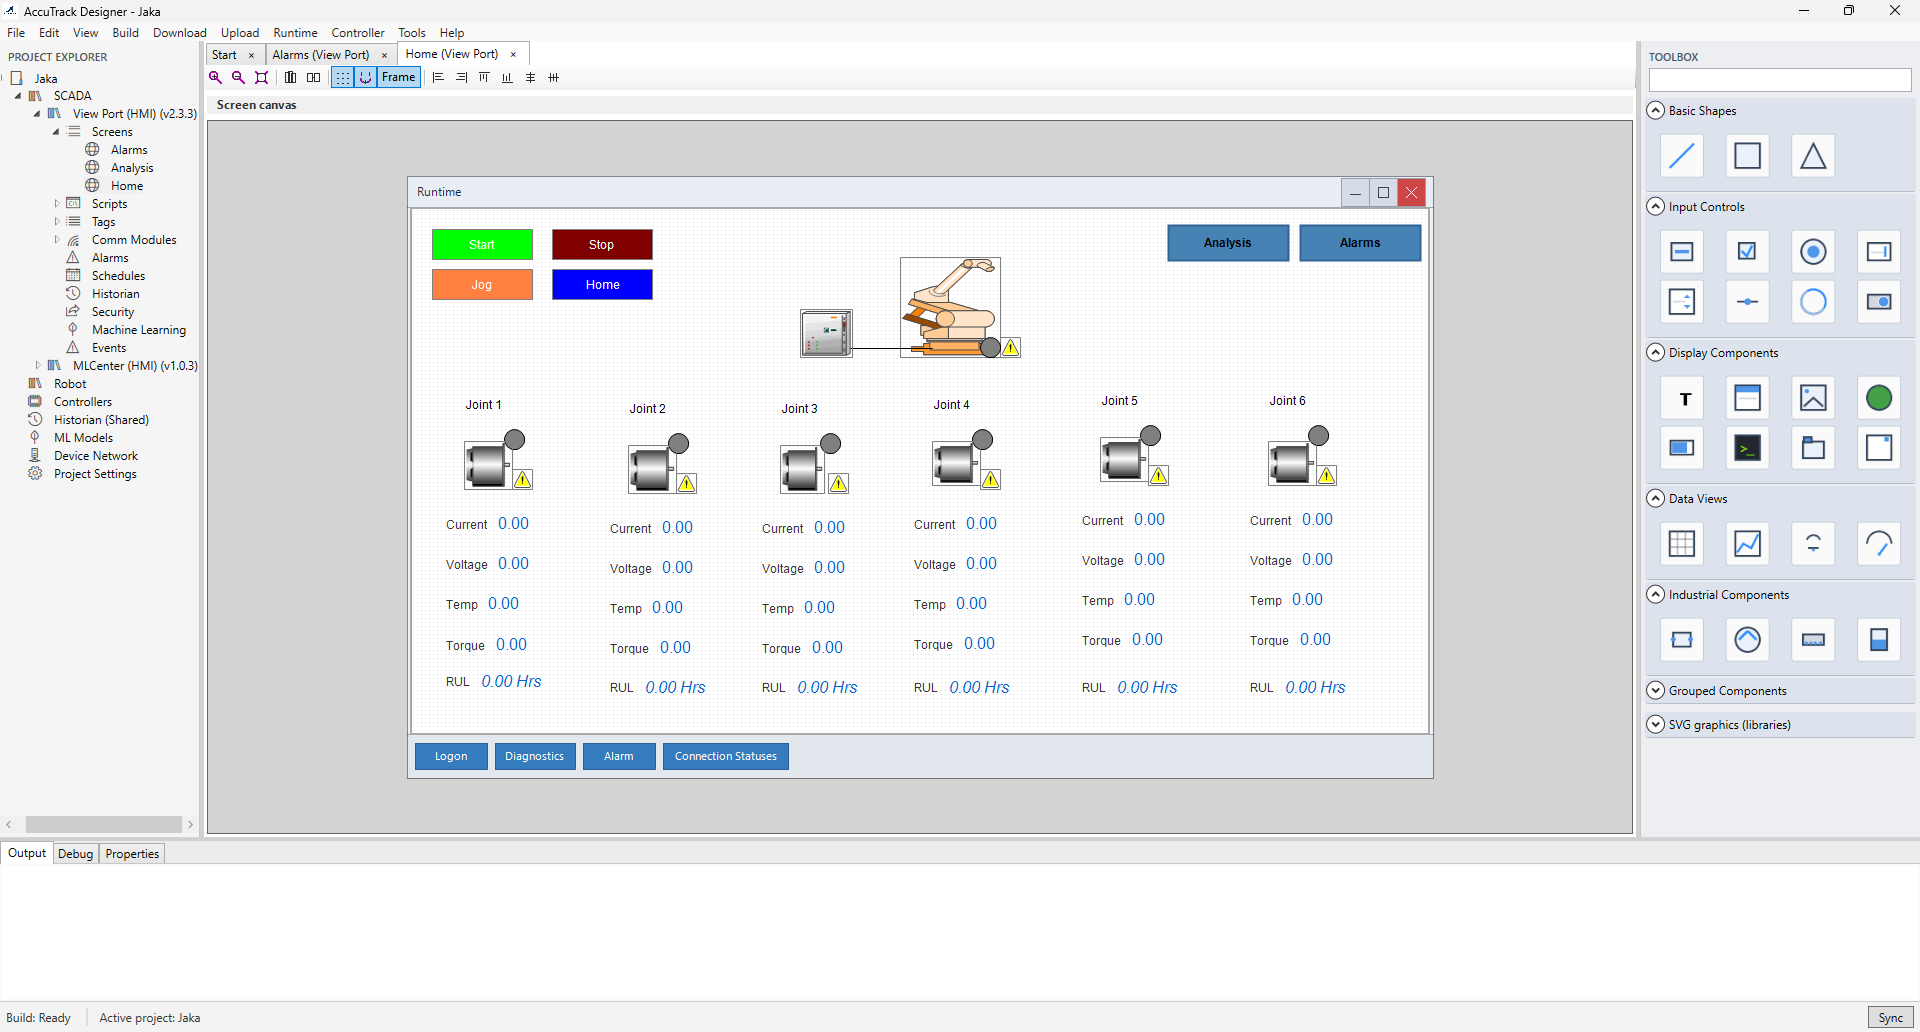
The Designer shell provides the project explorer, document tabs for each editor, a components palette for HMI work, and docked Output and Debug panes for build and diagnostic messages. Menus cover file operations, build (Build / Rebuild / Clean), download and upload to devices, tools, and help (including the user guide path).
Configuring modules
Configure modules from Project View → your SCADA project. The recommended order below reduces rework when one module depends on another (for example, tags and communication before bindings on screens).
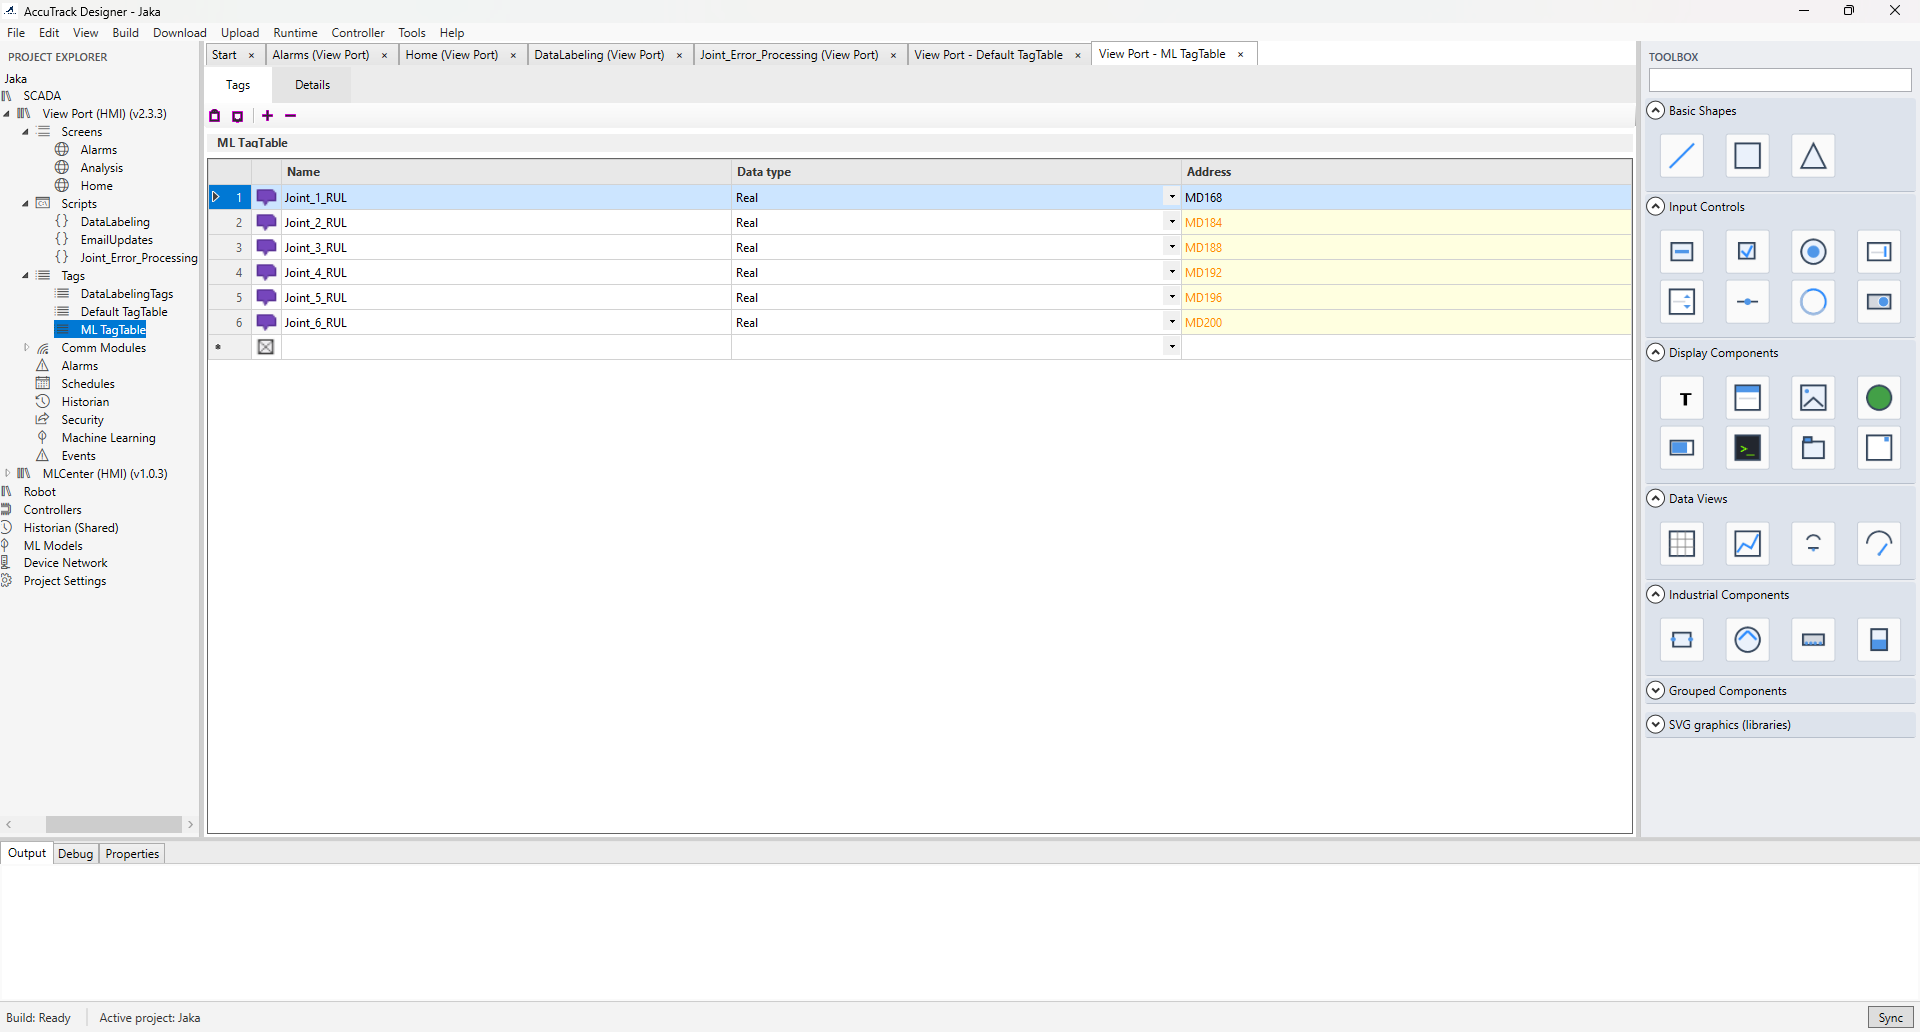
1. Tags
Tags are the central database of process variables (inputs, outputs, and memory) used by screens, scripts,
alarms, and communication. Create tag tables, add tags, and set name, type, data type, I/O address, scaling,
units, and access level. I/O addresses often reference driver connections (for example ModbusConnection1:40001).
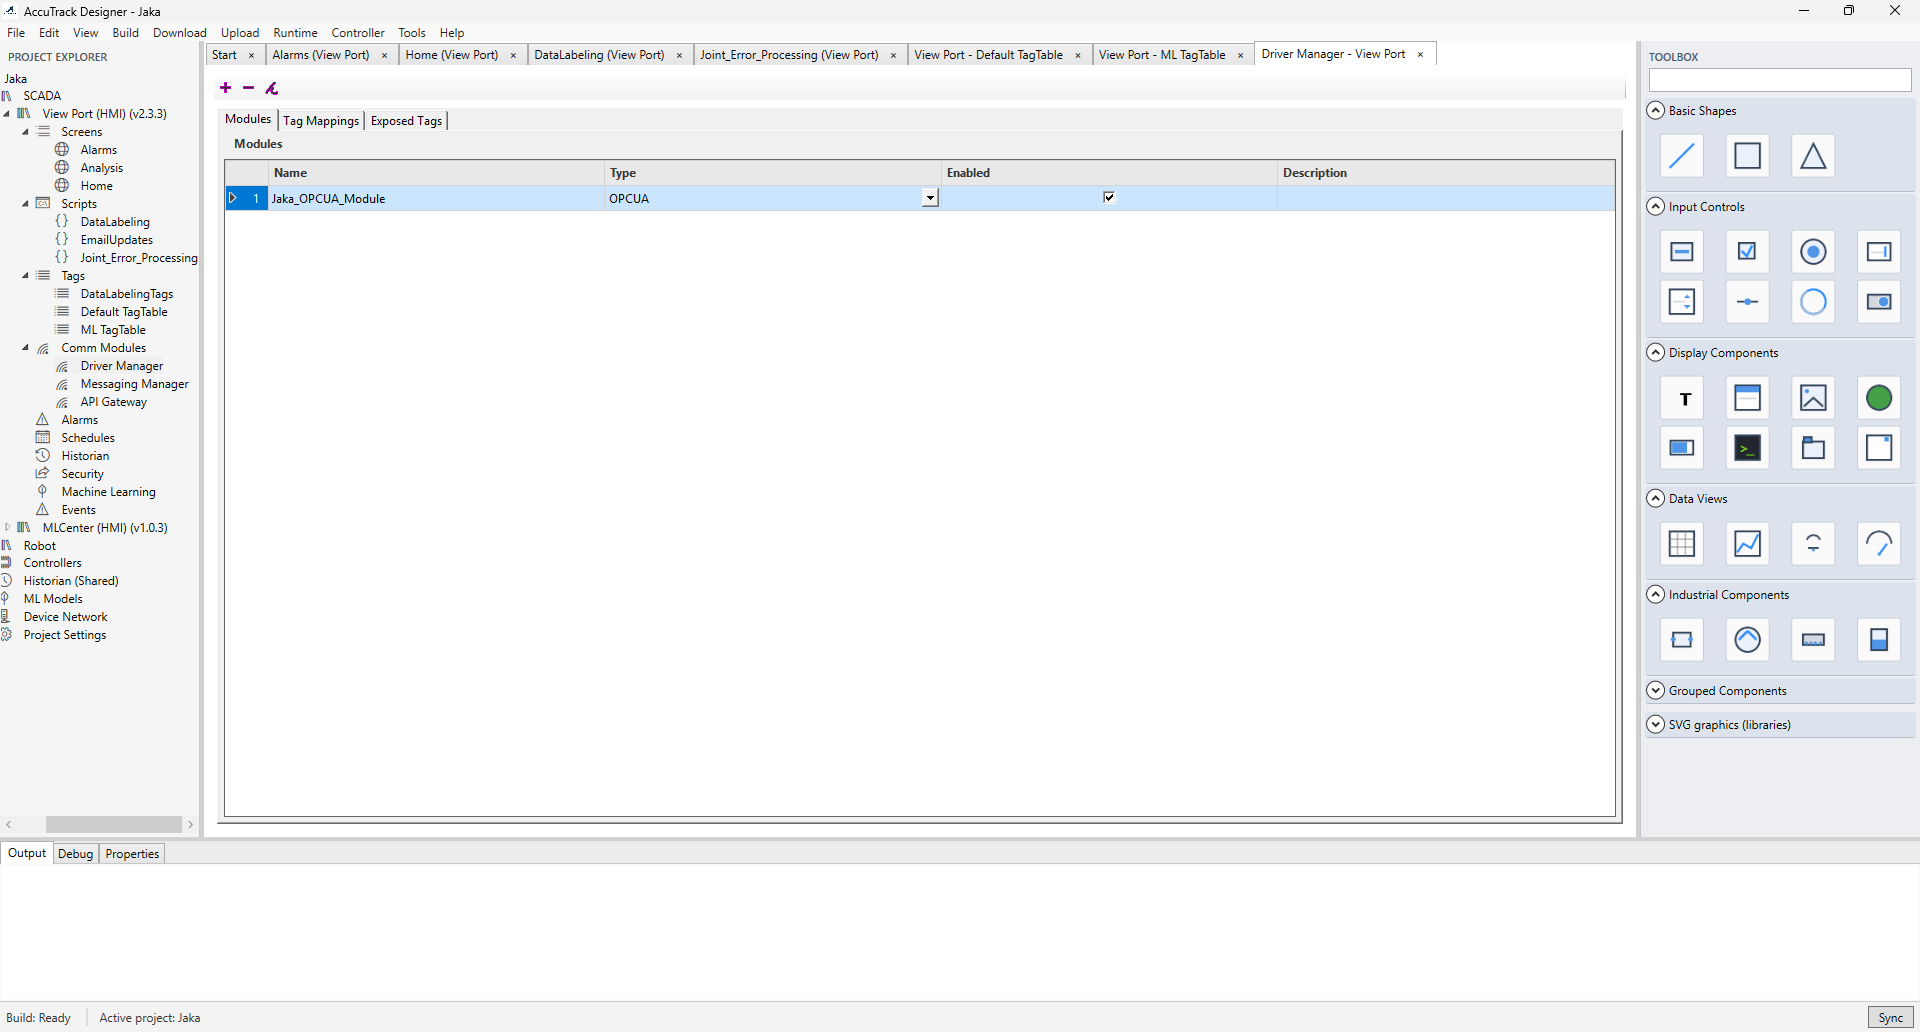
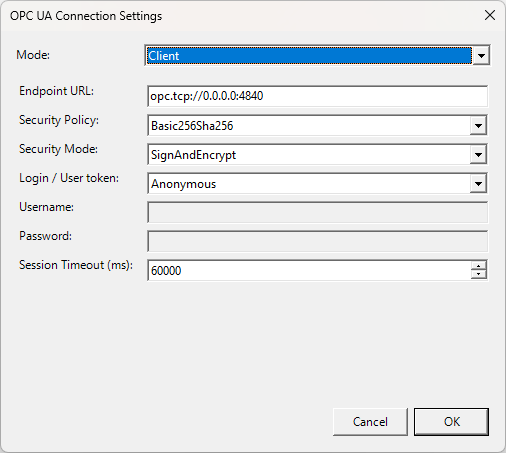
2. Communication
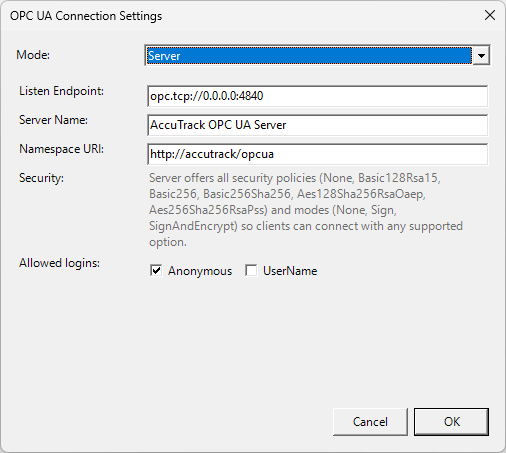
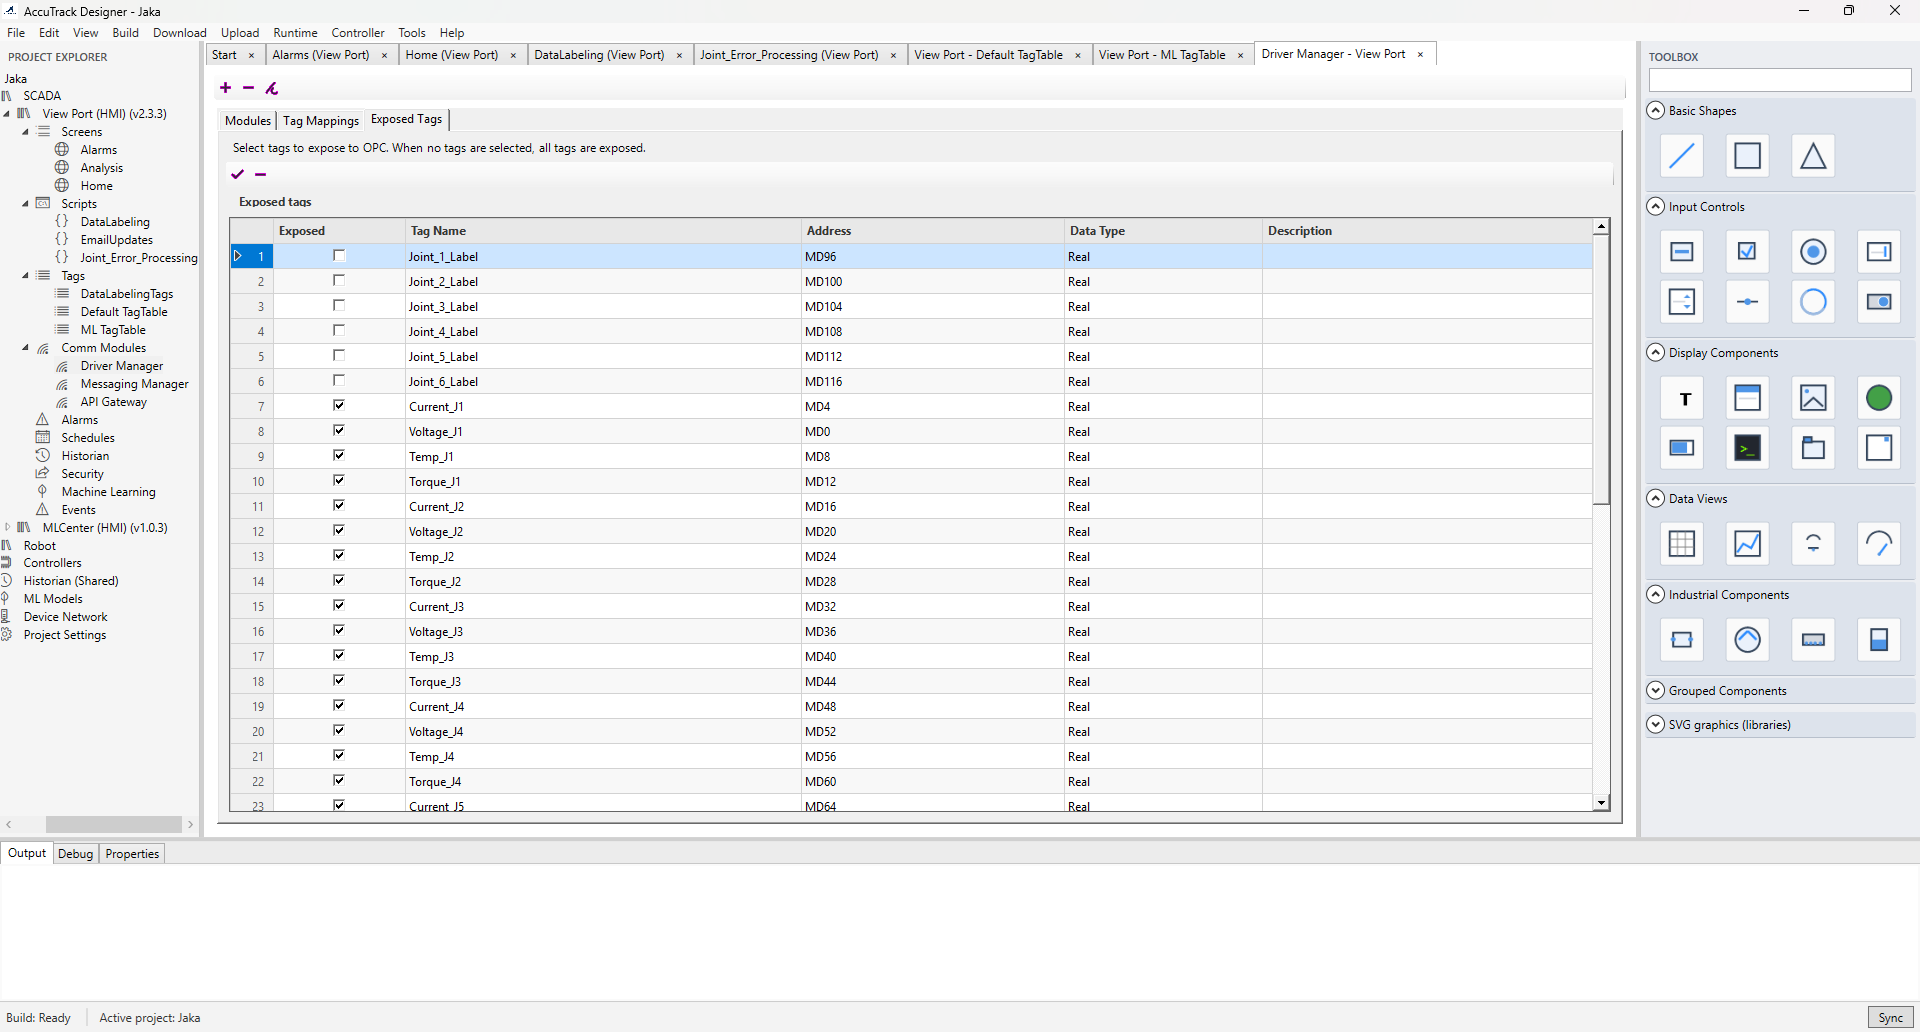
Under Comm Modules, use Add Module… to add the pieces you need: Driver Manager (Modbus TCP/RTU, OPC UA client and server), Messaging Manager (MQTT broker settings for Runtime to publish tag updates), and API Gateway (HTTP REST listen URL, optional API key and CORS). Map device addresses to tags in the tag editor; for OPC UA server mode, configure Exposed Tags.
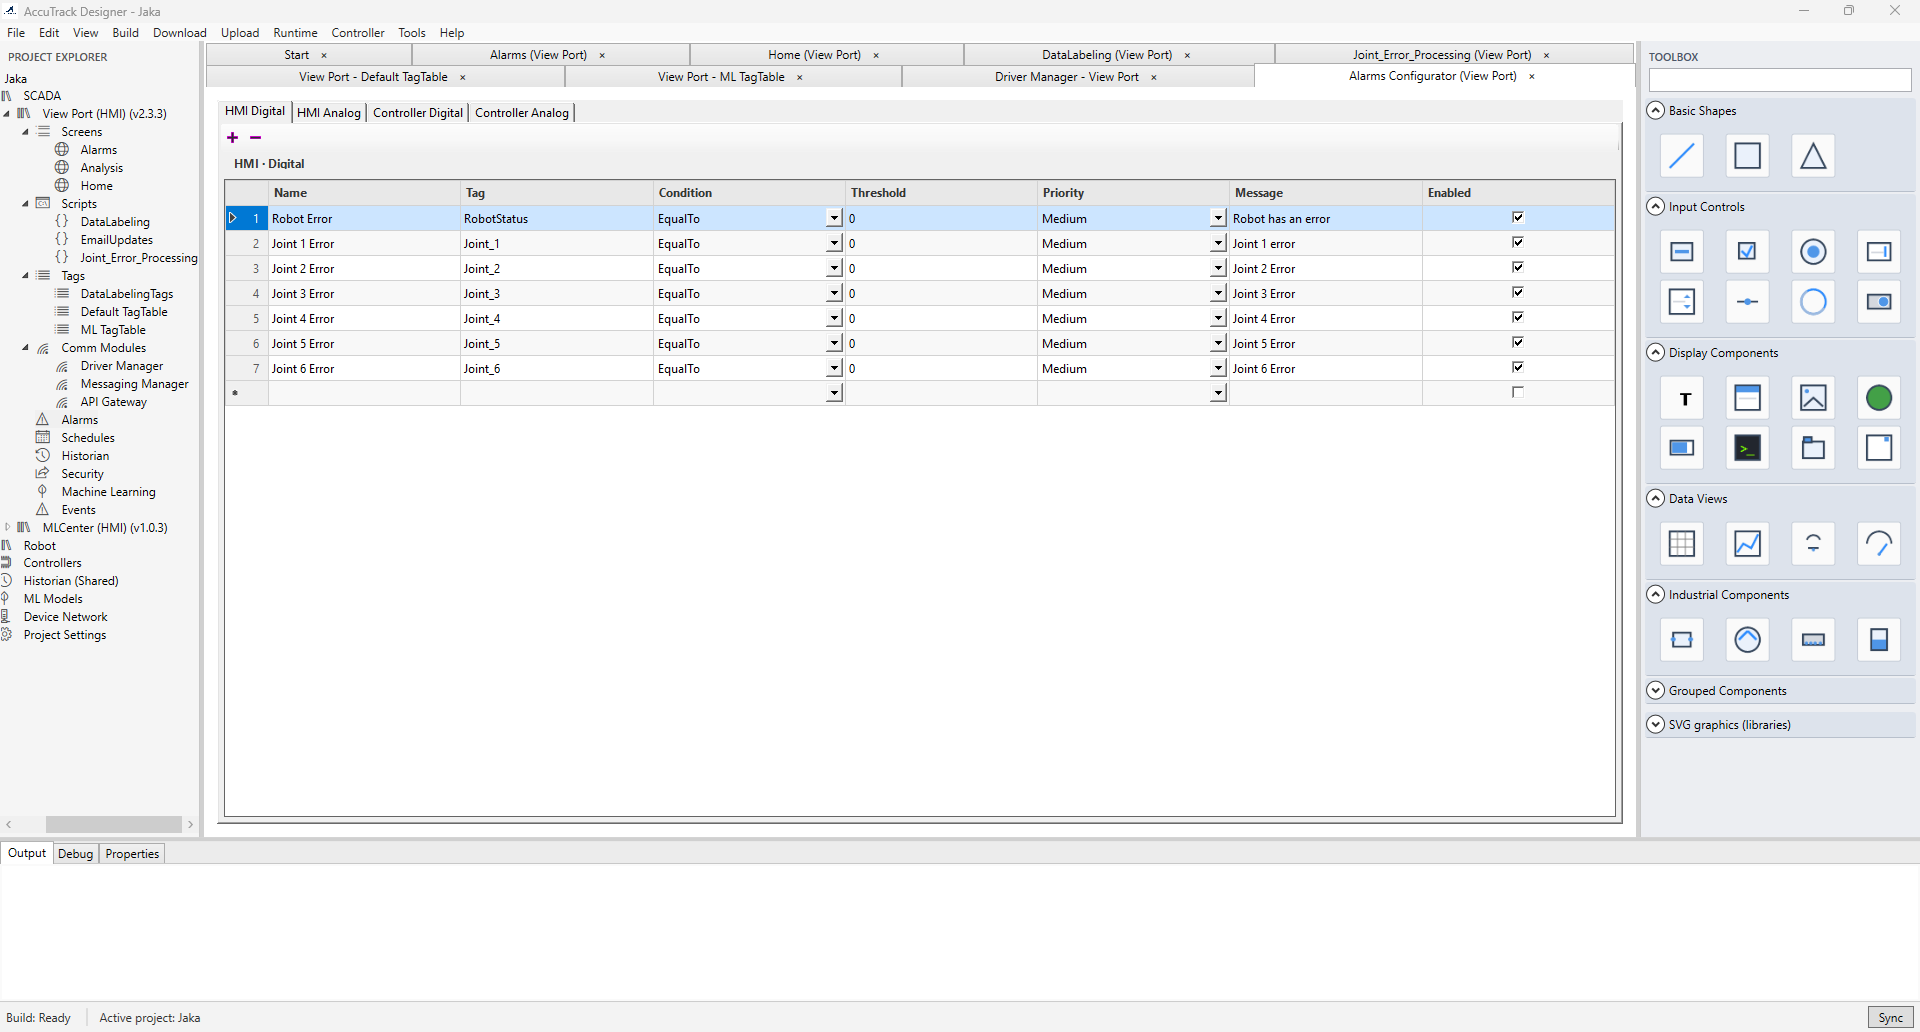
3. Alarms
Define digital, analog threshold, deviation, and rate-of-change alarms with priority, severity, and acknowledgement behaviour. Open the Alarms editor from the Alarms node.
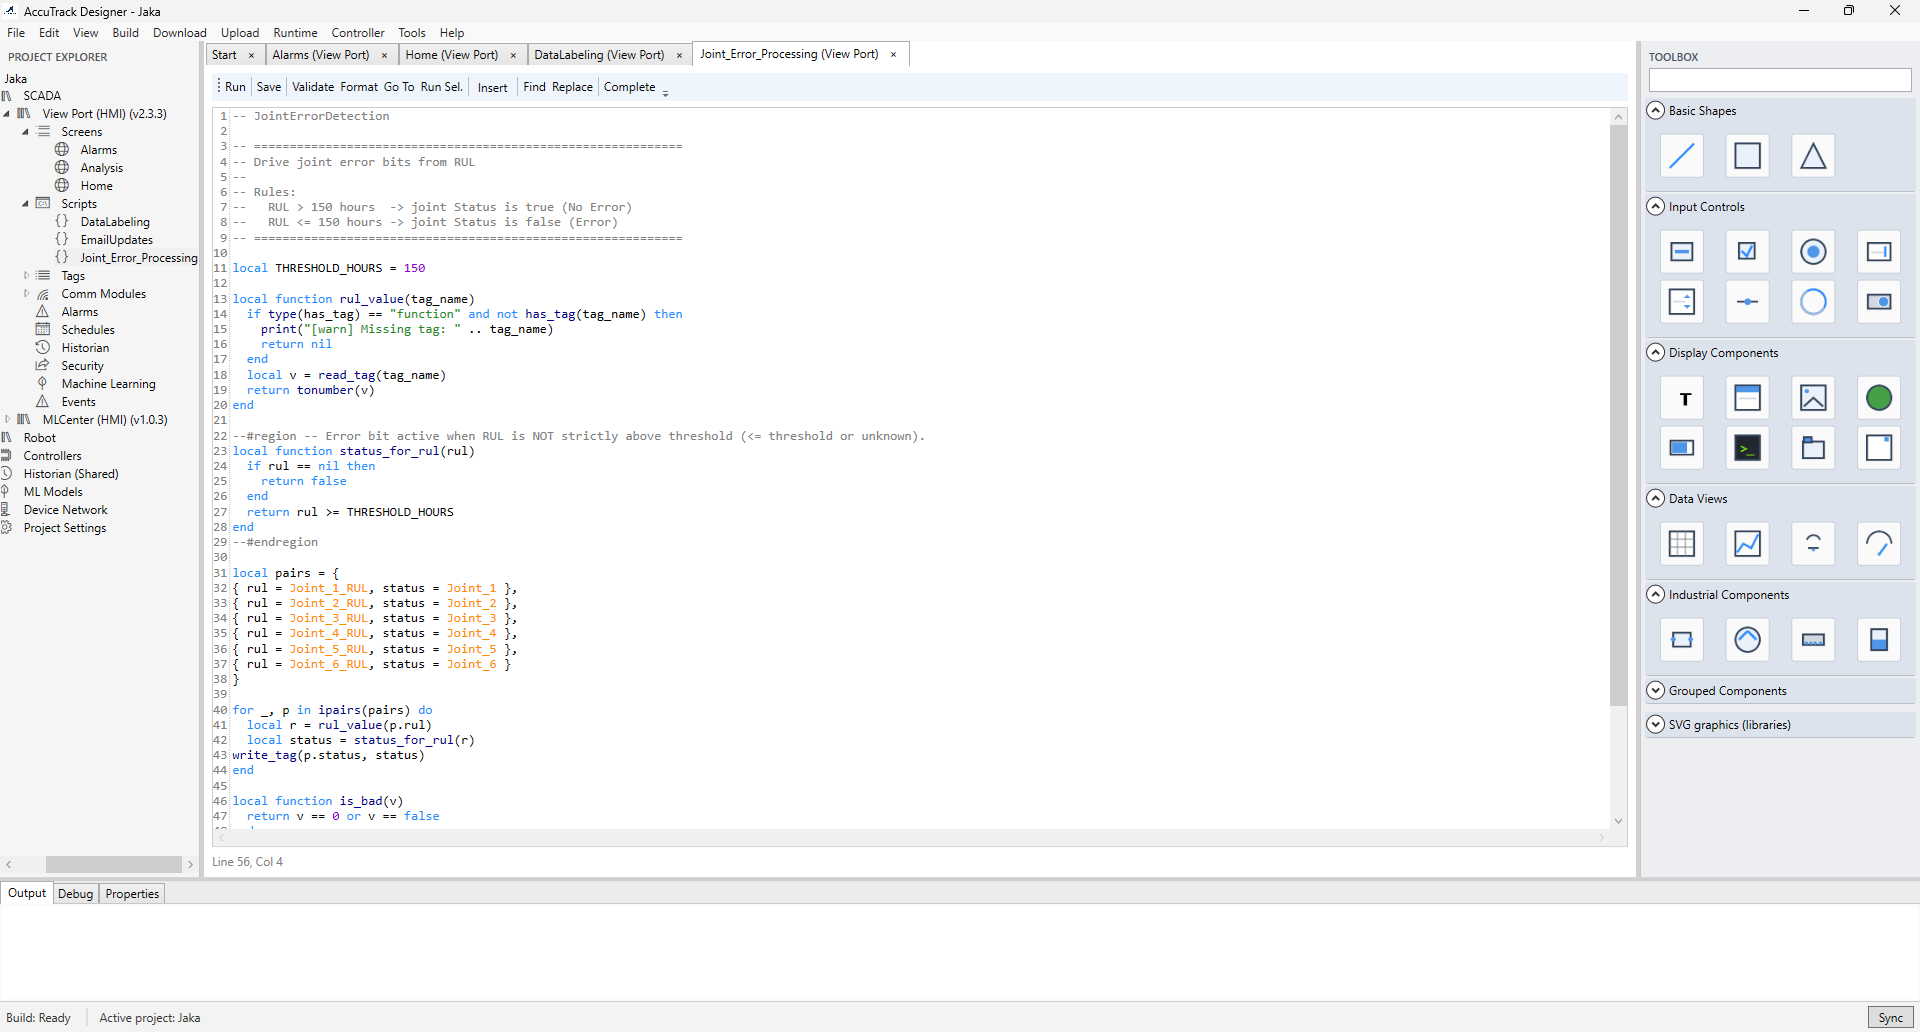
4. Scripts
Lua scripts implement custom logic (event-driven, periodic, or startup/shutdown). Scripts read and write tags and can interact with alarms; schedules can trigger script execution.
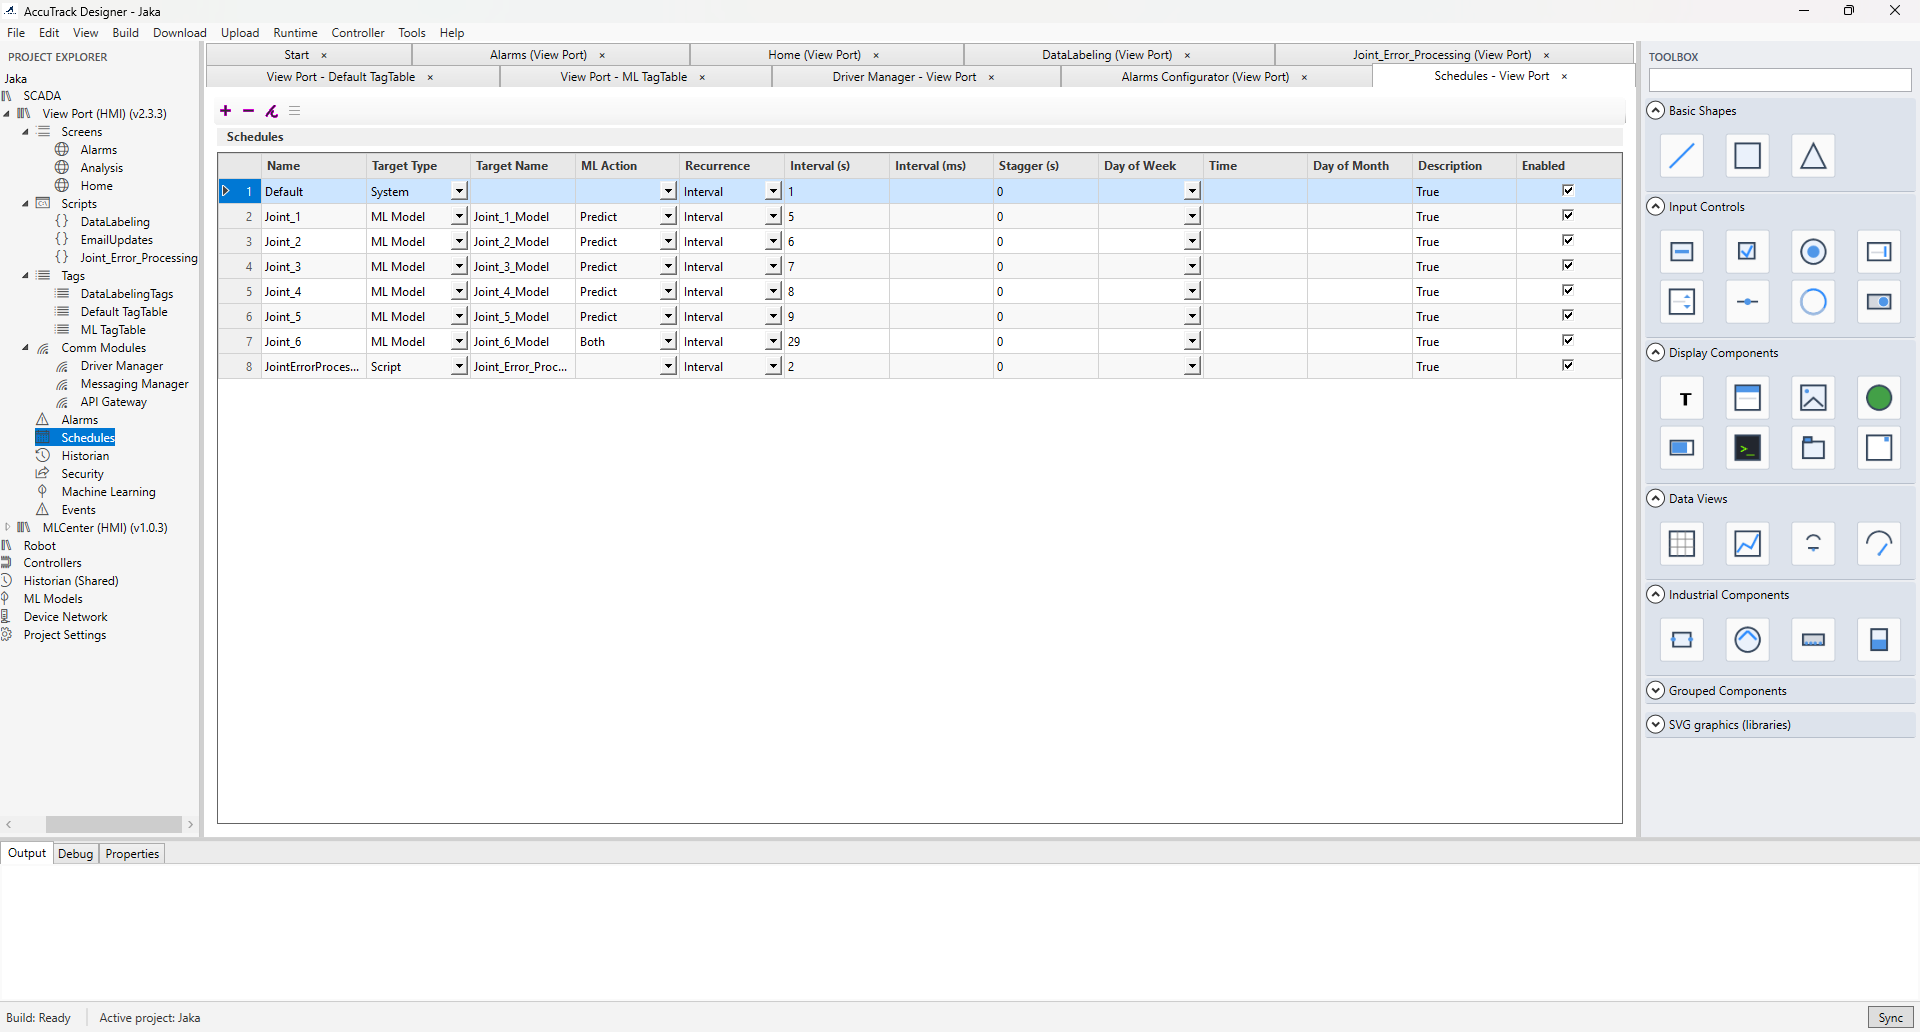
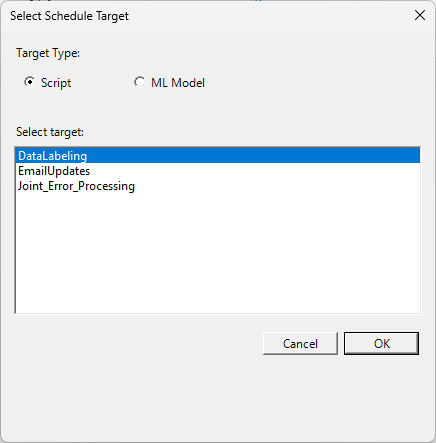
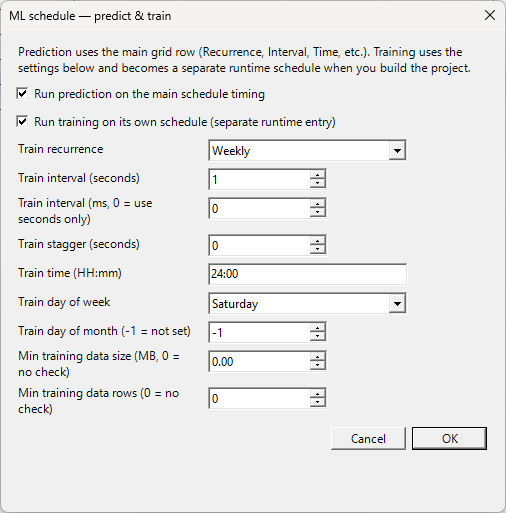
5. Schedules
Schedules run scripts on one-time, daily, weekly, or monthly patterns. Add a schedule, pick timing, select the script, and set priority and retry options as needed.
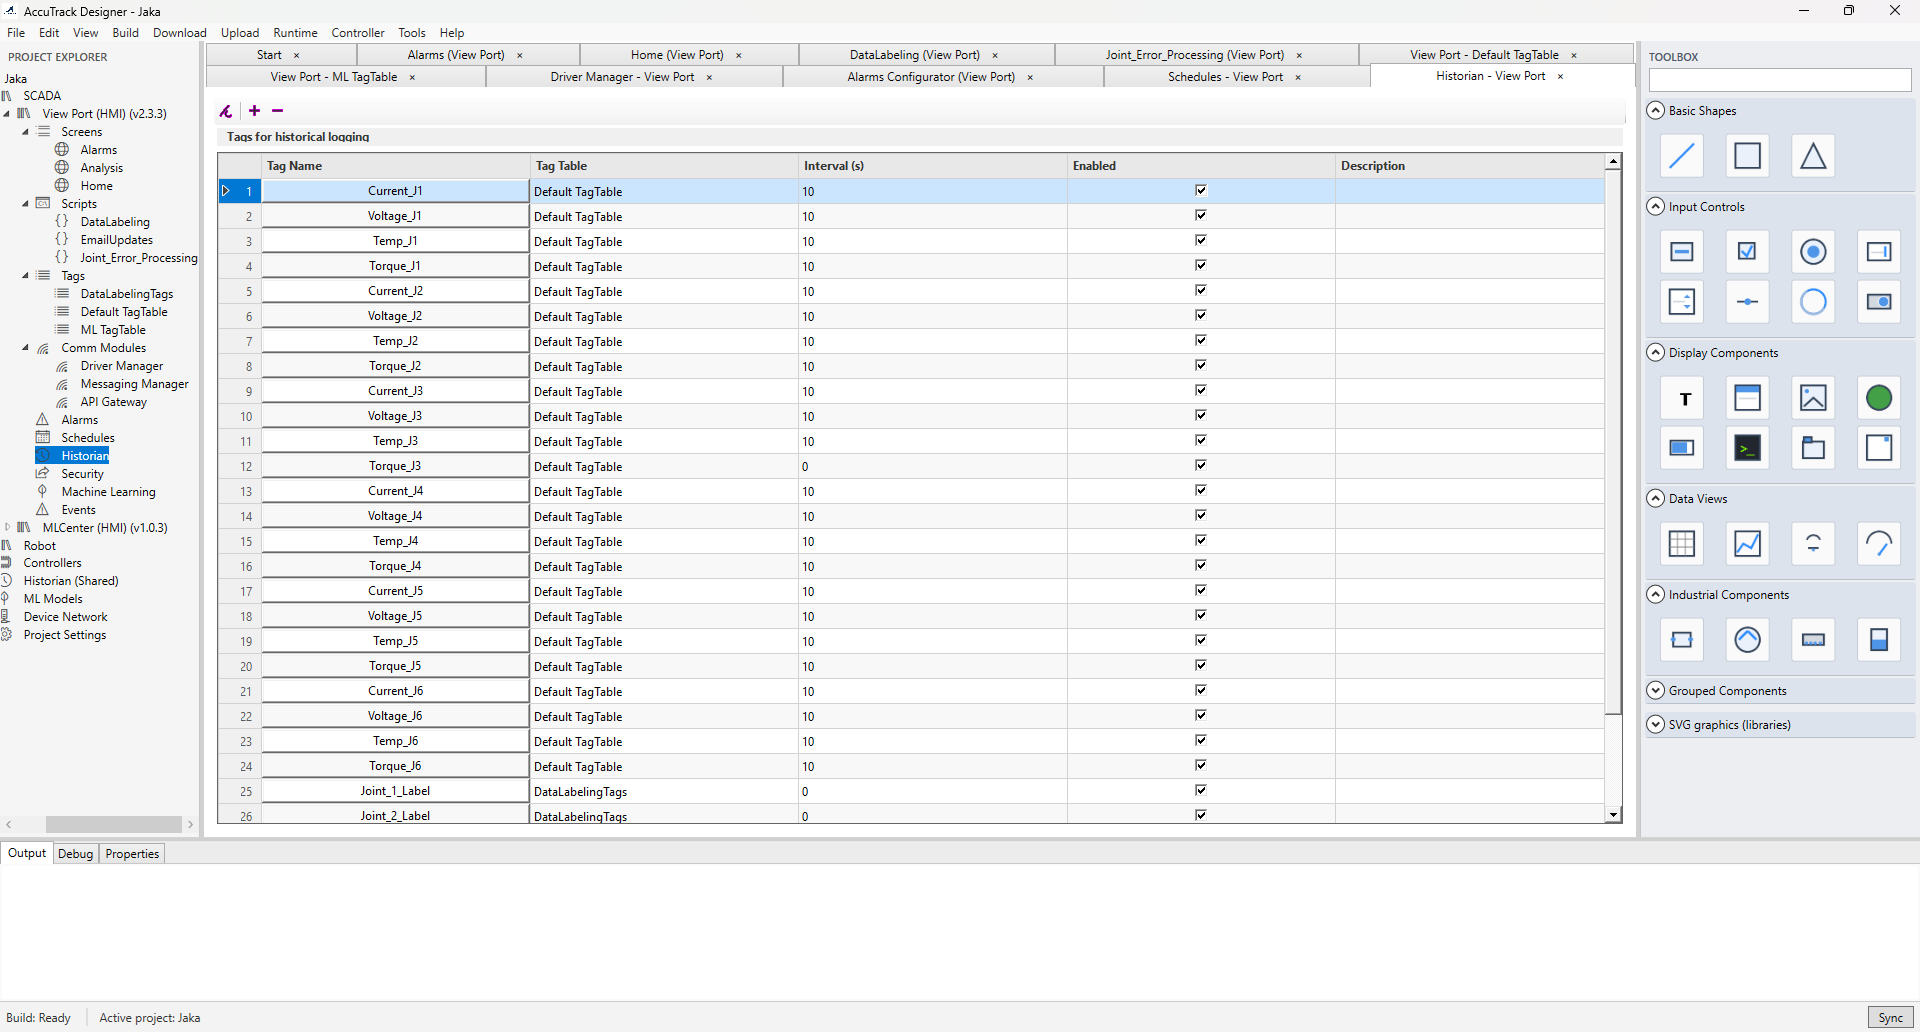
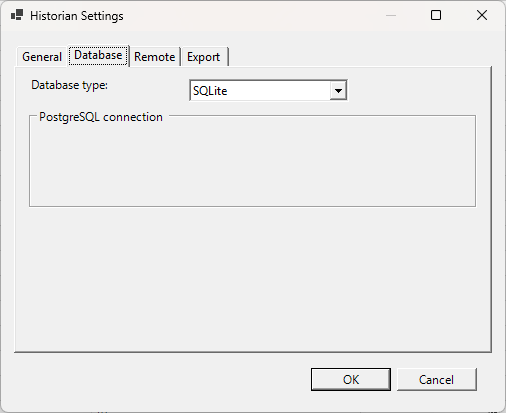
6. Historian
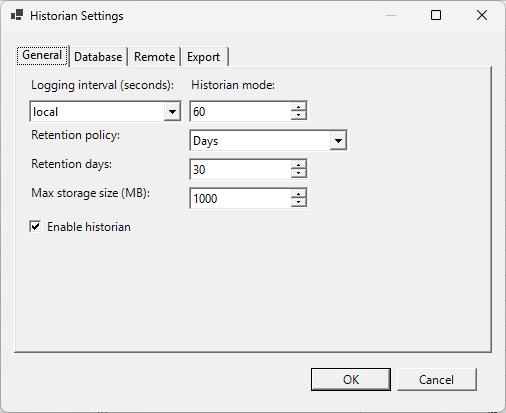
Historian settings define which tags are collected, sampling (periodic, on change, deadband), retention, and
mode: local (default) uses SQLite on the Runtime for autonomous edge operation;
remote uses HistorianService with a PostgreSQL backend—configure service URL, authentication,
retry, and offline buffering in historian.json when using remote mode.
7. Security
Configure users, groups, roles, and permissions (view, control, configure, admin) for tags, screens, scripts, alarms, and system settings. Set authentication and audit policies to match your site standards.
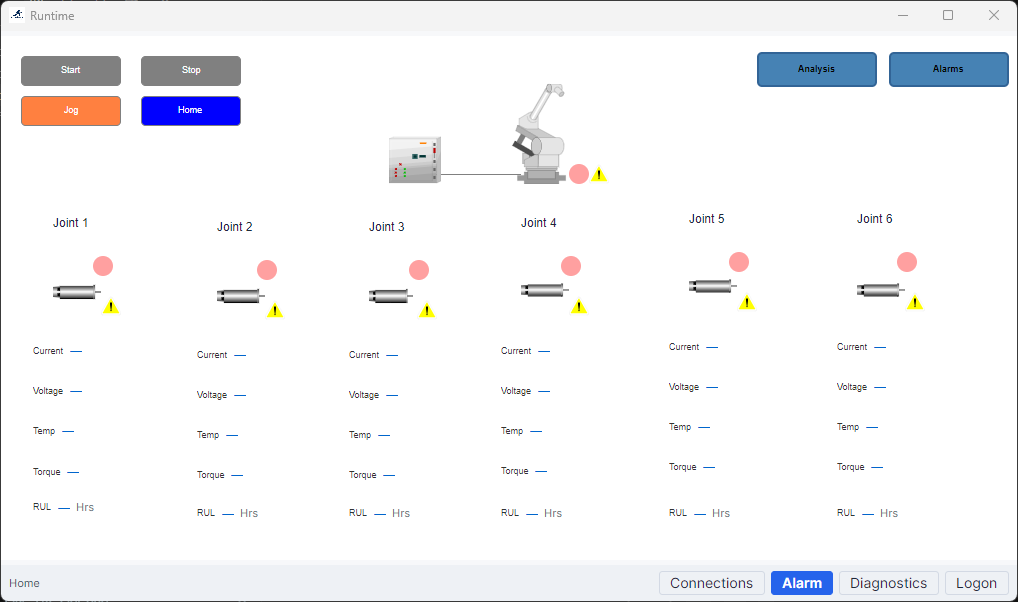
8. Screens (HMI)
Operator screens combine buttons, gauges, trends, alarm views, and industrial symbols with tag bindings and navigation. Add components from the palette, bind tags, set appearance and events, and apply screen-level security.
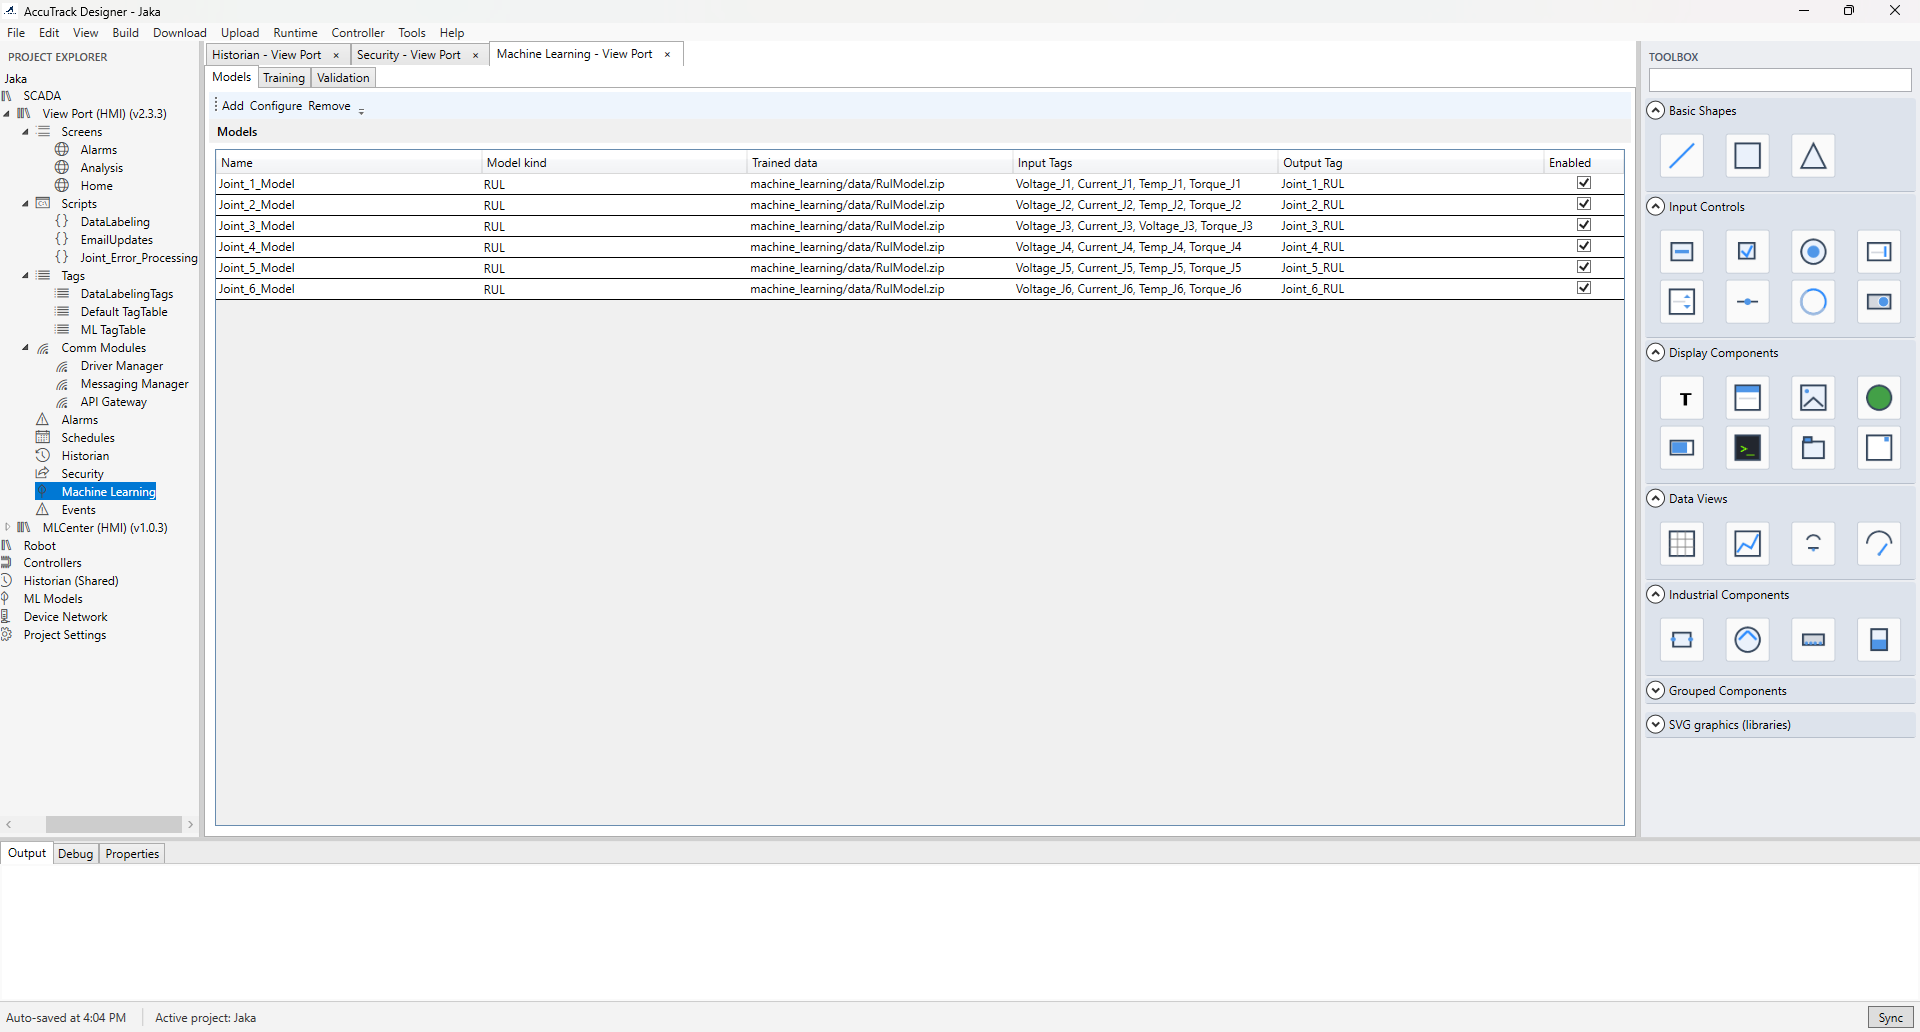
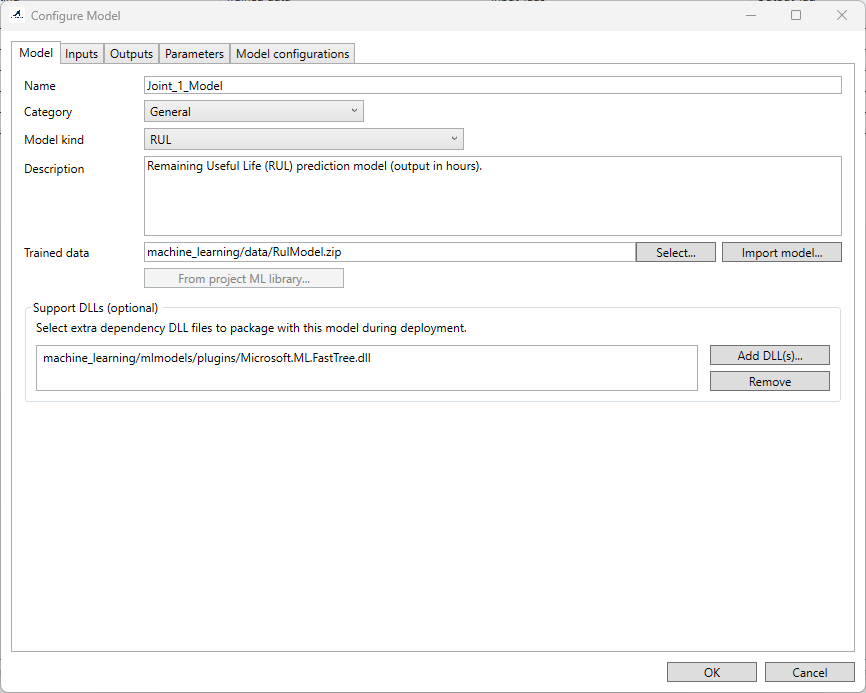
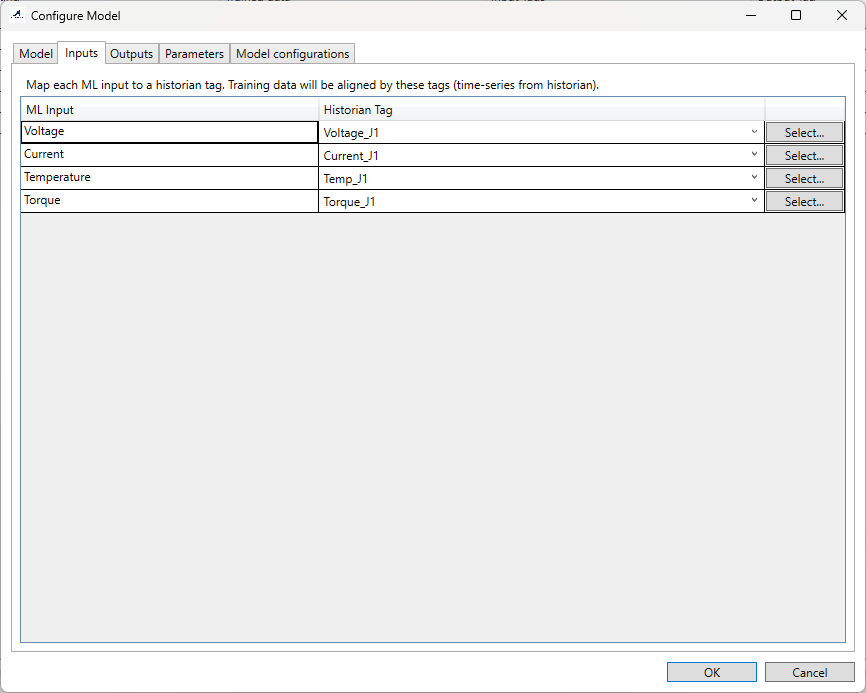
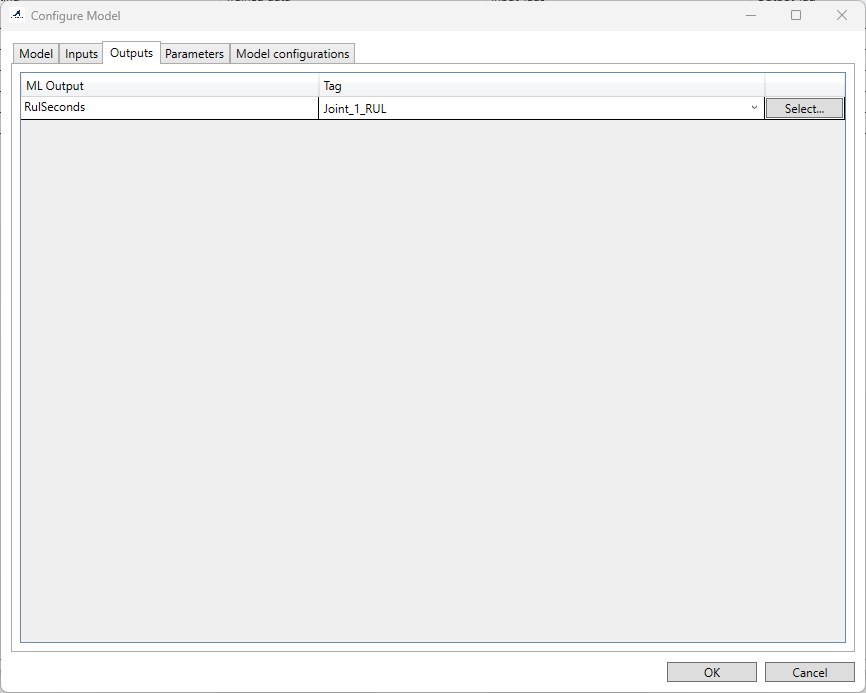
9. Machine learning
ML configuration attaches trained models to Runtime inference: pick model type (for example Fast Forest Regression or LightGBM), set the trained model file path, map input tags and an output tag, and optionally use historian time-series inputs or persist results. Use Configure… and Set trained data… in the ML editor to manage each model.
Building the project
Build after you change tags, screens, scripts, communication, alarms, security, machine learning, or related modules. Use Build → Build Project or F7, watch the Output tab, and fix reported issues (invalid tag references, script syntax, missing files, invalid addresses). Use Clean Project or Rebuild Project (Ctrl+F7) when you need a full refresh.
A successful build typically produces:
- A deployment package (for example under the project
build/folder). metadata.iscr— project manifest (name, version, resolution, config paths).- JSON under
json/for tags, communications, alarms, scripts, historian, security, and more. - Screen definitions under
screens/*.jsonfor the Avalonia Runtime. - Resources such as images and fonts.
Validation commonly covers tag references, screen references, Lua syntax, communication configuration, and security configuration.
Transferring to Runtime
After a successful build, deploy to the device that runs AccuTrack Runtime. Prerequisites: Runtime installed, network or local access, and sufficient storage and permissions.
- Download → Download to Device.
- Select the target device and deployment options.
- Transfer the project package and verify on the device.
To bring a project back from a device for backup or editing, use Upload → Upload from Device, then open the package in Designer.
Runtime treats the deployed configuration as read-only with respect to project layout; it does not redesign your tag structure from the field.
AccuTrack Runtime
The Runtime loads a deployed project from a data folder next to the executable. Expected layout
includes data/metadata.iscr (for autoload), data/json/ configuration files,
data/screens/*.json screen definitions, and data/images/ for assets referenced by the
HMI.
The toolbar includes Home (first project screen), Logs, and Alarms. The status bar reflects communication status. Discovery listens for project transfer (TCP 8888) and UDP discovery (8889); after transfer, Runtime opens the received project.
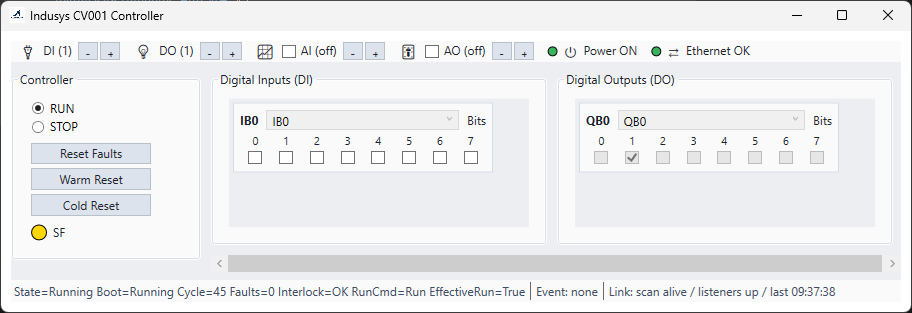
AccuTrack Controller
AccuTrack Controller is a separate downloadable component for embedded control using
Structured Text (ST). Programs are organized as POUs; the runtime executes a main program
each scan from deployed data/pou/ content alongside configuration such as tags.json
(process image and aliases), scan.json (scan period), and events.json where applicable.
Refer to the PLC ST language reference in the AccuTrack repository for supported syntax, IEC function blocks,
and patterns.
Download the Windows x64 Controller package from the downloads section on the main site.
Other configuration
- Project settings — Use the Settings node under the project for defaults and Runtime-related options exposed in your Designer version.
- Startup screen — Configure the default screen at Runtime startup when your project supports it.
- Environment — Allow firewall and ports for device download, discovery, MQTT, REST, and field protocols as required.
Quick reference
| Goal | Where to start |
|---|---|
| New project | File → New Project; save as .isc. |
| Tags | Project View → SCADA project → Tags. |
| Modbus / OPC UA / MQTT / REST | Project View → Comm Modules; add Driver Manager, Messaging Manager, and/or API Gateway. |
| Alarms | Project View → Alarms → open the alarm editor. |
| Lua scripts | Project View → Scripts → New Script. |
| Schedules | Project View → Schedules. |
| Historian | Project View → Historian. |
| Security | Project View → Security. |
| ML models | Project View → Machine Learning. |
| HMI screens | Project View → Screens. |
| Build | Build → Build Project (F7); check Output. |
| Deploy | Build first, then Download → Download to Device. |
| Retrieve from device | Upload → Upload from Device. |
For the full printable manual, use the Designer User Guide (PDF) from the documentation section, or the copy shipped with your installation.